Python for Finance: Part II: 3 Using Regressions for Financial Analysis

Regression

Mortgage
1. Size: Explanatory variable
2. Price: Dependent variable

Simple regression: Using only one variable
y = mx + b
y = α + βx

Multivariate regression: Using more than one variable

Implementation

Are all regressions created equal? Learning how to distinguish good

Y = α + βx + error

Residuals
– The best fitting line minimizes the sum of the squared residuals
=> OLS (ordinary least square) estimates

Good vs. Bad regressions (a comparison of explanatory power)
– Using the R square

S2 = (Σ (X-X)2) / (N-1)

TSS = Σ(X-X)2

TSS(Total Sum of Squares):
– provides a sense of the variability of data

R2 = 1 – SSR / TSS
– R square varies between 0% – 100%.
– The higher it is, the more predictive power the model has.

Python for Finance: Part II: 2 Measuring Investment Risk

variance

S2 = (Σ (X-X)2) / (N-1)

X=15%
X=14%
X=16%
X=13%
X=17%

(14%-15%)2 = 0.01%
(16%-15%)2 = 0.01%
(13%-15%)2 = 0.04%
(17%-15%)2 = 0.04%

Σ=0.1%

S2=0.1% / (4-1)
S2=0.033%
S2=0.00033

standard deviation

S = √S2

√S2 = √0.00033 = 1.8%

Implementation

Calculating the covariance between securities

The correlation coefficient measures the relationship between two variables.

Pxy = ((x-x) * (y-y)) / (σxσy)

x: house size
y: house price

Implementation

Considering the risk of multiple securities in a portfolio

(a+b)2 = a2 + 2ab + b2

Portfolio variance (2 stocks):
(w1σ1 + w2σ2)2 = w12σ12 + 2w1σ1w2σ2p12 + w22σ22

Implementation

Portfolio Variance

1. Variance of securities
2. Correlation (and Covariance)

3. Two types of investment risks
1) Un-diversifiable risk (Systematic risk): cannot be eliminated.
– Recession of the economy
– Low consumer spending
– Wars
– Forces of nature
2) Diversifiable risk (Idiosyncratic risk, company specific risk)
– Automotive
– Construction
– Energy
– Technology

Calculating Diversifiable and Non-Diversifiable Risk of a Portfolio

Machine Learning A-Z: Part 3 – Classification (Kernel SVM Intuitioin)

Kernel SVM Intuitioin

Data Type:
– Linearly Separable
– Not Linearly Separable => Kernel SVM

A Higher-Dimensional Space

Mapping to a higher dimension.

[1D Space] (x1)
f = x -5

[2D Space] (x1, x2)
f = (x -5)^2

[3D Space] (x1, x2, z)
=> can be highly compute-intensive.

The Gaussian RBF Kernel

Types of Kernel Functions

– Gaussian RBF Kernel
K(x,l→i) = e -(||x-l→i||2) / 2σ2

– Sigmoid Kernel
K(X,Y) = tanh(γ・XTY + r)

– Polynomial Kernel
K(X,Y) = (γ・XTY + r)d,γ>0

http://mlkernels.readthedocs.io/en/latest/kernels.html
(http://mlkernels.readthedocs.io/en/latest/kernelfunctions.html)

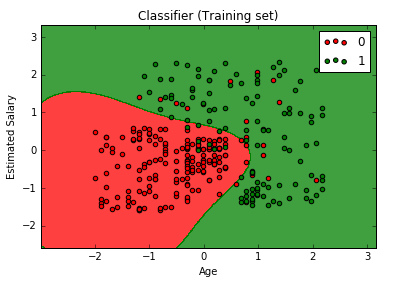
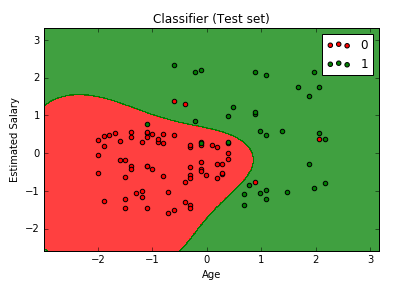
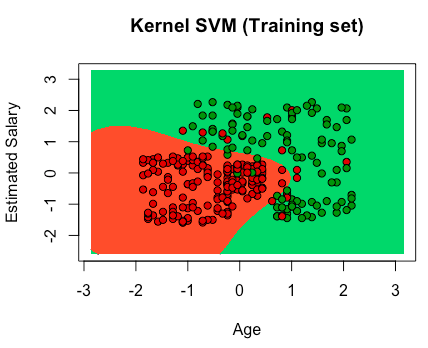
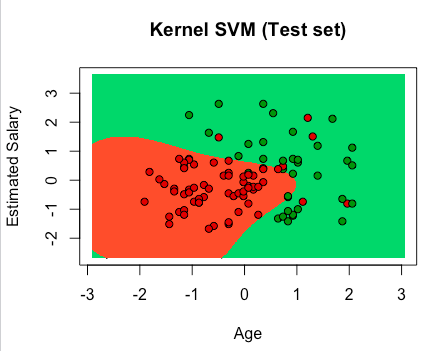
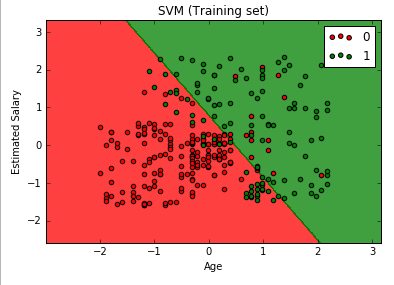
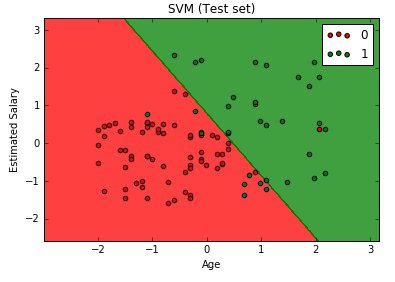
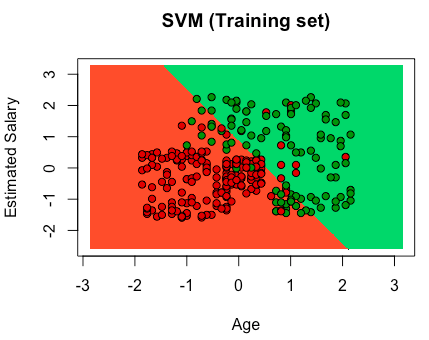
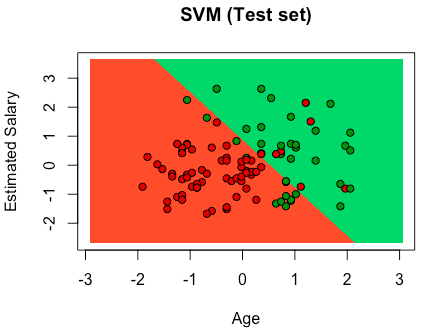
Implementation

Python

R

Machine Learning A-Z: Part 3 – Classification (SVM Intuitioin)

Support Vector Machine (SVM)

classification: how to classify added new data point.

Maximum Margin: a margin which has maximized space between support vectors.
Support Vectors: vectors which decides the maximum margin.

Maximum Margin Hyperplane (Maximum Margin Classifier)
Positive Hyperplane
Negative Hyperplane

Implementation

Python

R

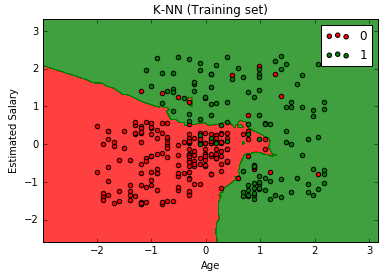
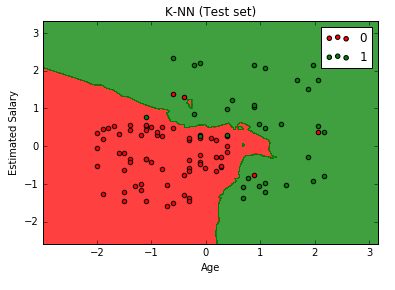
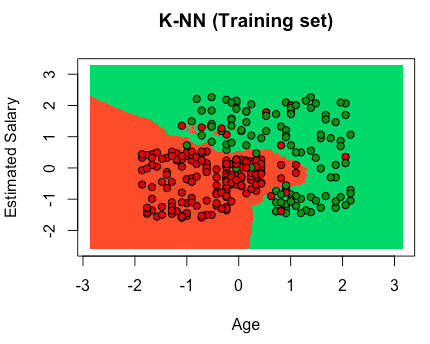
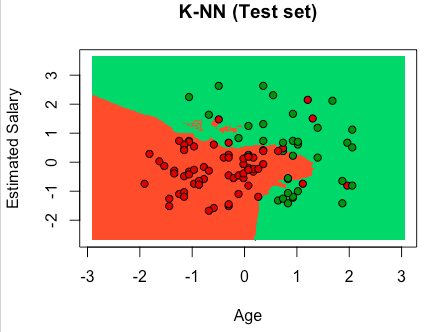
Machine Learning A-Z: Part 3 – Classification (K-Nearest Neighbors)

K-NN Intuition

How do we classify a new data point between category 1 and 2?
K-NN identifies which category the new data point should be in.

STEP 1: Choose the number K of neighbors

STEP 2: Take the K nearest neighbors of the new data point, according to the Euclidean distance

STEP 3: Among these K neighbors, count the number of data points in each category

STEP 4: Assign the new data point to the category where you counted the most neighbors

Euclidean Distance

2 points:
P1(x1, y1)
P2(x2, y2)

Euclidean Distance between P1 and P2 = √((x2 – x1)2 + (y2 – y1)2)

Implementation

Python

R

ページトップへ